
Learning Objectives
- Design a basic operations plan.
- Identify the basic operations and supply chain management strategies.
- Draw conclusions based on the findings.
Assignment Overview
Assignment Type
This is an individual assignment. Each participant is required to submit their response by uploading the answer document in MS Word format.
Time Estimate
10 hours
Passing Threshold
40%
Requirements
For this assignment, you need to choose any physical, consumer product such as a car, smartphone, furniture, watch, toothpaste, sanitizer, shoe, microwave, refrigerator, or fan. Identify a company that manufactures the product that you have chosen. The identified company should be a publicly listed company (NYSE/NSE/BSE/Forbes top 500 company).
Based on the organization that you have identified, answer the following questions. To find the relevant information to answer these questions, refer to the company website and annual reports (annexures to the balance sheet and director’s note). In addition, you can refer to other sources of information such as press releases and news articles. You may also need to refer to the annual report of the other companies in the same business, partners, and competitors. Include the reference to your source of information in your answers.
Question 1
How does the company describe itself or its manufacturing plants from the following perspectives:
What is the product category?
What is the company’s standing related to competition?
What is the overall company strategy?
What are the company’s operational strategies?
What are productivity aspects of the company?
What is their approach for quality control regarding their products and plants?
What are the details of the process selection and facility layout of the plant?
How have they done strategic capacity planning?
Why was the specific plant location chosen?
Integrate the above points with the overall product quality, production capacity, and process quality control of the plant/company. Do you think the product quality or price represents what the company states?
(Approximate word limit: 800–1,000)
The product category is automobile. The company’s excellent management of supply chain helped it overcome the semiconductor shortage. During the year, the company’s performance was much better in comparison to others (see Figure 6). In fact, Toyota topped General Motors in car sales in United States 1. Also, this was the first time in history that any foreign automaker sold the most cars in United States. The company is ranked number one by sales volume.
The company strategy is focusing on electric vehicles, release 15 BEV models which includes seven new battery electric vehicles models of bz series by 2025. Also, the company plans to integrate newer technologies such as semi-automated driving, connected cars and smart cities and newer battery technologies.
The company’s philosophy is centered around ‘Lean Manufacturing’ and ‘just in time’ production. The company wants to reduce water wastages, use rainwater, recycling by following the principle of ‘kaizen’.
The company policy is to manufacture in countries where the demand is economically feasible, and this provides competitive advantages. The company uses Production system widely known as “Toyota Production System (TPS) which is based on two principal – “Just-in-Time” and “Jidoka”. Just-in-Time is a method in which essential parts and components are produced and transported in small amount in a timely manner when needed. Jidoka is a manufacturing theory which entails urgent halt of production when challenges occur in the assembly line for quality assurance. One method that is used by company is utilization of sophisticated information technology to address issues in every stage of vehicle development process i.e., from planning of product to commencement of mass-production. Kanban tells you what to produce, when to produce and how much to produce by handing cards along in the manufacture process. Generally, until the earlier production process hasn’t passed a card. Its called a pull strategy, which means that the production only starts when there is demand. This also reduces lead time which mean more customers are satisfied and there is less holding. Kaizen philosophy is also adopted so that the product improvement is always happening by generation of new ideas and experimentation. Employees are encouraged to decipher problems and come up with ideas to improve the process.
Cost reduction is done by competitiveness through localization, components and manufacturing reforms, sharing parts and manufacturing products corresponding customers’ needs as per geography and car category in conjunction with ‘Ryohin-Renka Cost Innovation’ (elimination of waste in all processes) approach. The company has been able to spread fixed costs more over the no of units with its lean manufacturing technique as compared to its competitors. The facility is designed to meet the aforementioned tools and principles.
The company chose to tie the company’s output with that of Ford, however, upon analysis they found ‘genci genbustu’ which means waste and defects. So, the company developed one-piece flow. One-piece-flow concentrates on the highly efficient flow for the manufactured goods. The system keeps the materials flowing. The movement is reduced through intelligent flow management and defects are identifies quickly. The workstation units are adaptable and can be changed to adjust their function and shifted to another sequence. The processes are balanced with each other as per the the demand rate. Standardization if fundamental to the flexibility of the system which is driven by demand or pull system. The worker use production instruction written on Kanban for signaling (see figure 8).
Toyota ensures capacity is adequate by two different ways: workforce management and production control. In the workforce management approach, all workforces must respect the work of the others at the core, also termed as ‘people-centered’. The workers must be consistent on their approach to production so that no overproduction happens. They should also decrease the number of workers to carry out specific tasks. Another approach is production control system which is based on customer orders through implementing flexible capacity among each step-in order to either save time or increase capacity to meet customer’s demand. ‘Monthly Planning’ using the first month’s sales figures and market share is used to estimate the total production volume for the next month. Similar approach is used in consultation with sales teams for annual production planning. This approach ensures a balanced capacity level.
The company’s focus on continuous improvement of the product means that the product has a high quality. The company’s recent investment in Mexico based plant with the aim to solidify the operation in North America could provide the company with strategic advantage as the plant is near the target market. So, there might be cost efficiency, faster delivery times and streamlined supply chain. The company operational strategy is flexibility and volume (Differentiation: variety). The company’s pull strategy reduces lead times, and which also reduces the holding costs for the company whose saving could be passed on to the consumer in the form of lower prices. So, due to the ability to provide good quality product at reasonable price, the company’s sales are highest among the auto industry players (see Figure 6).
Question 2
For the company you chose in question 1, describe the supply chain by identifying all the supply chain levels. Discuss this from the following perspectives:
How do the raw material and products move within the supply chain? Provide details about the movement regarding the technology used, vehicle typologies used, warehouses used, logistics infrastructure owned or outsourced, and patterns in terms of geographies.
What are the production cycles? How frequent is the product movement?
Provide reasons to support the company’s choices about movement of raw material within the supply chain and production cycles.
(Approximate word limit: 500–600)
Toyota and its associated firms manufacture automobile, and its components are produced in 50 production companies in 27 nations expect Japan. Major production capabilities include plants in Japan, India, Canada, United States, France, United Kingdom, Czech Republic, Poland, Russia, Turkey, Chania, Thailand, Brazil, Argentina, Indonesia and South Africa. Hino brand vehicles are manufactured at eleven production companies in eleven countries and four plants in Japan. Daihatsu vehicles are manufactured at two production companies in Indonesia and Malaysia and four plants in Japan.
The company’s distribution network is the largest in Japan which consisting of 268 dealers employing 110,000 people and operating approx. 4600 sales and service outlets (see Figure 1). The only dealer owned by the company is TOYOTA Mobility Tokyo Inc. Independent sales network and exceptional customer care has increased the sales in the domestic market. Traditional approach such as door-to-door sales are decreasing in favor by showroom sales. Following covid and intense competition, the company has allowed all sales outlets to sale Lexus brand and all other brands.
In other region, the company’s automobiles are sold via approx. 168 distributors in 203 nations and region (see Figure 2). Additionally, via these distributors, it maintains its network of dealers. Africa has the highest number of distributors whereas China has the lowest.
The company procures parts and components from all over word for its 50 overseas operations in 27 countries. The suppliers are selected after competition based on quality and costs. Cost reduction is done by competitiveness through localization, components and manufacturing reforms, sharing parts and manufacturing products corresponding customers’ needs as per geography and car category in conjunction with ‘Ryohin-Renka Cost Innovation’ (elimination of waste in all processes) approach. After manufacturing the vehicle, the standardized system of global distribution moves the product to the end users in a timely manner.
Distribution systems used in US can be further divided into three categories:
Distribution of vehicles manufactured in North America: After factory, vehicles are brought to the marshalling yard, where they are prepared and shipped to dealership offices by truck or train.
Distribution of vehicles produced overseas: Large containers are used to carry vehicles manufactured in Japan to ports in North America based on the proximity to dealers. Usually, the delivery time is between three to five weeks.
Scion model of distribution: In Scion model, the automobiles arrive with only basic equipment installed to be further customized accordingly as per specifications.
European distribution pattern is different due to lack of room for vehicle stock as most of the deals are situated in urban areas. Normally after production the product is moved to marshalling yard and then shipped or moved by truck to hub (consolidation place). Some small countries share a single hub whereas some bigger countries have multiple hubs. These ‘hubs’ perform the function of warehouse, and the inventory is managed in concert with dealer.
The production is done once a customer makes an order. This is different than traditional push approach. The batches are small with less inventory, single minute exchange of die (SMED), production flexibility is some of its features. Cycle time at each station is based on takt time which is cycle time matching demand. Normally the product is moved very frequently in small batches.
The company moves the product in such a way because the holding cost is higher and the whole supply chain efficiency is more. This way the coordination between the actors within the supply chain is greater than other systems.
Question 3
Have there been any changes in their operations management/supply chain logistics and transport management strategies in the last five/ten years? What are these changes? Why did they initiate these changes? Provide reasons to support the changes made by the company.
(Approximate word limit: 300–350)
In 2019, Typhoon Hagibis caused huge damages in Japan, but the company’s operations was restored quickly due to the early rebuilding of affected areas and by alternative production by suppliers.
In 2020, the world economy except China experienced a year-on-year contraction, in both advanced and developing countries due to COVID-19, as well as voluntary stay-at-home efforts and stay-at-home orders lead to difficult situations such as launch of substantial monetary easing measures and reduction in public spending in many countries around the world. In Europe resurgence of new cases and repetitive lockdowns triggered economic stagnation. USA, one of the biggest markets of the carmaker, recovered quickly due to major stimulus measures and monetary easing policy. In the midst of an economic slowdown in Japan triggered by spending tax raise in October 2019, the financial system suffered a sudden slowdown due to declaration of state of emergency and voluntary stay-at-home due to the epidemic. China experienced a rapid recovery from mid-2020 due to early suppression of the spread of COVID-19. The pent-up demand and the electric tax incentive increased the sales of electric vehicles in China whereas Other Asian nations experienced slowdown.
The automotive industry was affected by the preceding factors due to which the industry suffered a year-on-year reduction for the third consecutive year causing a market contraction more than during the 2008 financial crisis. Both advanced and developing countries largely logged year-on-year contractions, including China, which achieved an immediate economic recovery, logged a year-on-year slowdown for the third consecutive year. Advanced markets, which had ample economic capability, have recovered more rapidly than developing markets, and the velocity of recovery has differed from nation to nation, as it is affected by the pervasiveness and seriousness of contaminations.
With the tightening of the environment regulations and the expected discontinuation of sale of petrol and diesel vehicles has shifted the demand trajectory for electric vehicles. This has changed the company’s operations as the assembly line and supply chain are modified to serve excess demand of electric vehicles. New suppliers who supply electronic components for Electronic Vehicles are being integrated into the supply chain. For example, the company partnered with Denso for manufacturing and expansion of electronic parts at Toyota’s Hirose Plant for quick production structure. In 2017, the company entered a partnership with Panasonic for production of prismatic battery business. Similarly, Toyota and Mazda collaborated in production of compact cars based on hybrid technologies. Lithium-ion battery usage in electric vehicles demanded a new shift for the company and the company did so with collaboration with multiple new suppliers. In April 2019, the company gave away the royalty rights to multiple patents related to electrification-related technologies such as system controls, power control units (PCUs), and electric motors.
The company shifted their focus of operation to incorporate electric vehicles because of the heightened awareness and operating cost efficiency, incentives offered by governments around the world, leading to increase in demand, tightening of environmental regulations. The company gave the patents for free so to promote widespread use of battery electric vehicles. Various external factor changes mentioned above caused the change in operation and its strategy for remaining competitive in the market and for catering to new need of the consumers.
Question 4
Discuss the strengths, weaknesses, opportunities, and competition the company has been facing in the market from the supply chain perspective in the last five years, as provided in their annual reports. What are their plans and strategies to cater to these issues? Could these plans and strategies have been better?
(Approximate word limit: 500–600)
Strengths
- Innovative production practices such as TPS, JIT and automation with people.
- Strong focus on Research and Development.
- Extensive production and distribution network.
- Integration of genuine Toyota Parts distributors with auto supply companies.
- Collaboration with dealers. For example., In Thailand sales of pickup segment due to mod shops reluctance to modify them. However, after having dealers and organizing events to display modified trucks increased customer appeal and market share increased.
- Strong portfolio of environmentally friendly new vehicle technologies such as HEV, PHEV, BEV and FCEV.
- Focus on automated driving to assist and promote safety using technology such as MIRAI.
- Shift to connected cars with software first approach and use of big data for development of autonomous vehicles.
Weaknesses
- Gap in expectation versus reality in vehicle performance especially in electric vehicles
- Shortage of essential components such as semiconductor
- Increase in input costs as a result of supply chain disruption
- Product recalls can affect brand image
Opportunities
- Growing automobile industry especially in China and other emerging markets.
- Localizing the design, manufacturing automobile and their parts and components as per the regions in which they are sold. This way the company can reduce exposure to currency rate fluctuations, trade restrictions and tariffs.
- Reduction of carbon emission from factories by investment in renewable energy generation system, purchase of renewable energy power2.
- Establishment of battery collection and recycling systems for battery swaption.
- Growth in demand for electric vehicles as two-third of urban resident’s support ban on sale of new petrol and diesel vehicles after 2030 in Europe3.
- Using advanced information technologies to enhance productivity in the production process and product development.
- Shift towards cars as a service along with integration of smart home and smart cities as a ecosystem.
Threats
- New regulations intended to reduce negative effects on the ecosystem, increasing vehicle safety and improving fuel economy. Recall of the product because of non-compliance could increase costs and the operations are affected.
- Sourcing of conflict minerals (gold, tin, tantalum and tungsten) from countries such as Congo and others could be prevalent in the supply chain.
- With the integration of information technology in the cars in collaboration with third parties to manage, transmit and store information raise the risk of unauthorized access or attacks by hackers.
- New entrant entry into electric vehicles segment.
- Automotive industry is affected by many factors which may persist in future. Mitigation strategies:
- Close collaboration with business partners within the supply chain.
- Localized design and manufacturing could lower disruption risks.
- Operation of chemical substance management framework in cooperation with its suppliers for mitigation of negative impacts dude to production and use of chemical substances.
- Implementation of Toyota Green Purchasing Guideline in collaboration with suppliers on implementation of environmental initiatives.
- Streamlining production systems with the use of advanced information technologies
- Bolstering and encouraging Ryohin-Renka Cost Innovation (“RR-CI”) activity for removal of excess from all activities such as design and production alongside guaranteeing the consistency in addition to safety.
- Improve manufacturing efficiency by installation of more flexible equipment and systems, altering automobile body designs to enable production of larger array of models on each assembly line and for sharing more modules between cars.
Demand for automobile is tied to per capita disposable income, fuel prices, vehicle prices and product innovation. So, the company’s focus on innovation and the industry’s trajectorial shift to connected vehicles and autonomous vehicles with integration of internet of things-based devices and technologies could propel the company to newer heights. However, due to intense competition, discovery of new technologies and adaption of new technologies quickly by competitor can result in failure for the company.
Question 5
Identify and outline the various issues that the company faced or is facing during the Covid-19 crisis. Highlight the effect of the pandemic on their year-on-year growth projections, profitability, production plans, supply chain disruptions, inventory management, logistics management, market share value, and market capitalization.
(Approximate word limit: 300–350)
The various issues that the company is facing during the COVID-19 crisis are as follows:
- Increase in raw materials prices such as steel, precious metal, aluminum and plastic parts.
- Shortage of essential components such as semiconductor.
- Reduced in demand due to disruption caused by pandemic.
- Temporary shutdown or suspension of assembly of vehicle and components at factories in Japan and other regions.
Due to the pandemic, achieving the 9 million sales target is going to be hard due to semiconductor shortage4. In 2021, the whole industry sold just over 15 million new vehicles well below the expectation of 2.5%5. However, that is 2.5 percent more than in 2020. During the year the company reported an 8.9% decrease year-on-year, to 27.21 million yen. The unit sales dropped by 1.3 million (14.6%)6. The reduction in production volume due to demand shock affected the operating income and net profit. By region, the revenue decreased by 6.6% in Europe, 10.8 percent in North America, 9.1% in Japan and 11.4% in other regions. Due to better availability of semiconductor, the company is better poised than competitors for fulfilling the demand. The company expects its sales will increase by 2.4%7. The share price of the company has increased from $108.08 to $199.77 In percentage terms, it is an increase of 84.84% (see Figure 4). The market cap of the company has increased by 42.52% since 2019 (see Figure 5). The rise indicates that the company’s investors’ expectations are high. The company’s successful inventory management of semiconductors helped the company’s performance in comparison to rivals.
Appendix
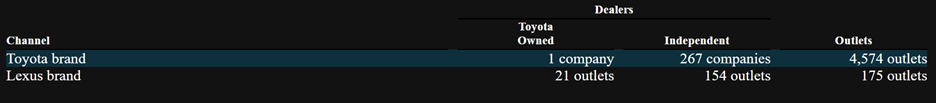 Figure 1: Dealers and outlets in Japan
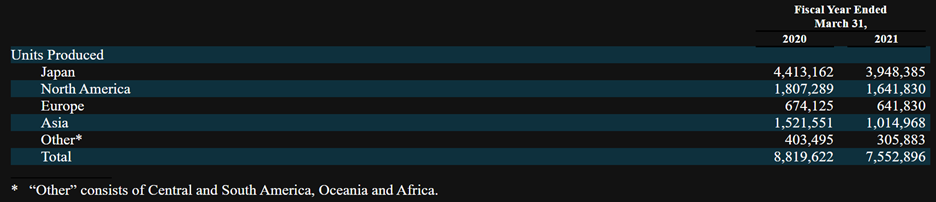 Figure 2: Production data per region
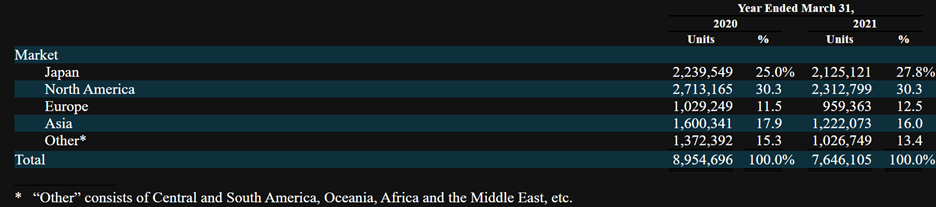 Figure 3: Unit Sales per region
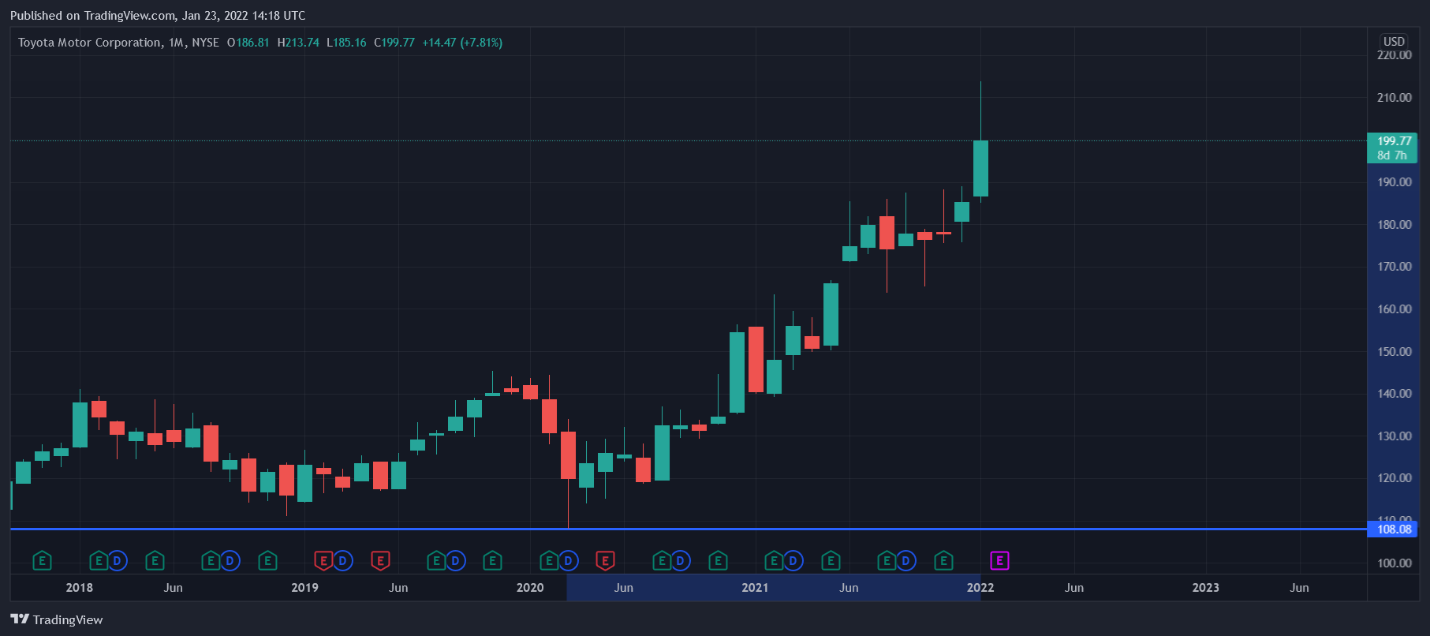 Figure 4: Share price movement
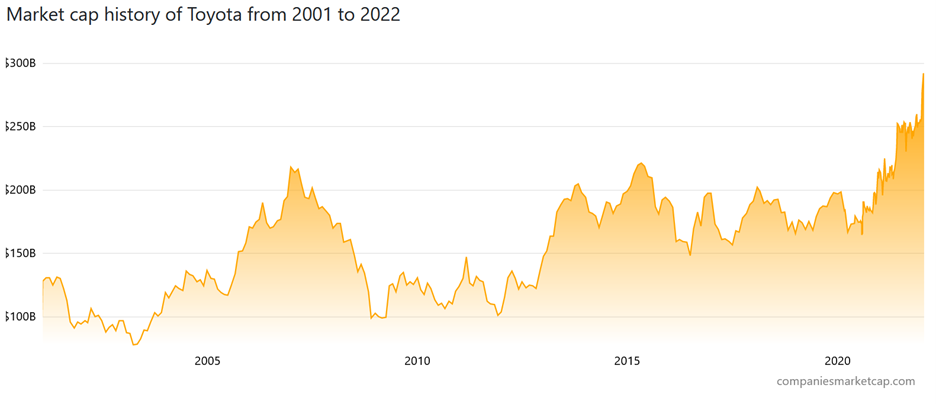 Figure 5: Market Capitalization movement
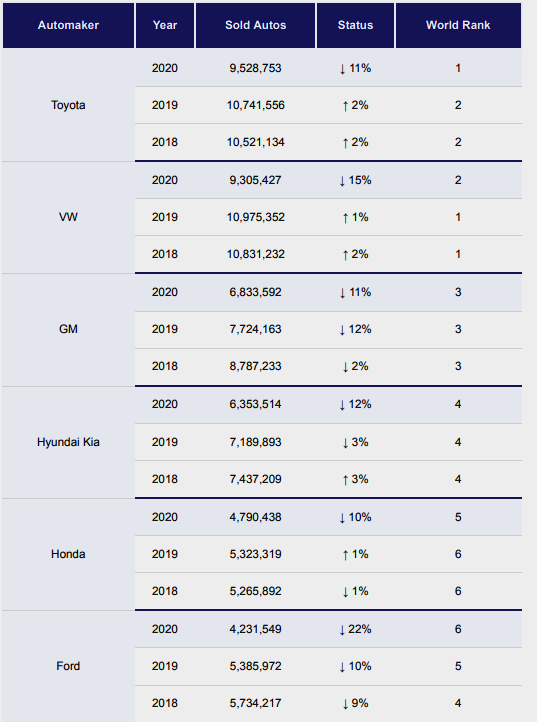 Figure 6: Sales comparison of automobile companies
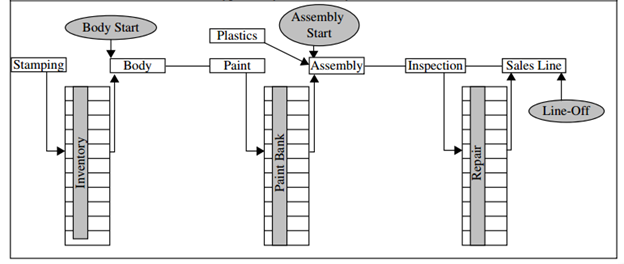 Figure 7: Assembly Plant Flow
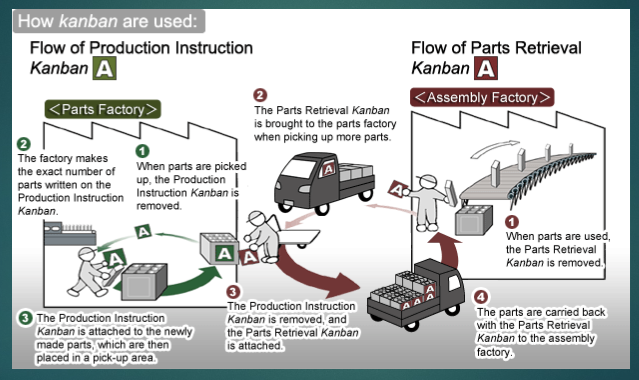 Figure 8: Flow of Production Instructions
Footnotes
Disclaimer: Using this could result in failure as this is against university policy. This is for learning purpose only!
Boudette, E. N. (2022, January 4). Toyota Topped G.M. in U.S. Car Sales in 2021, a First for a Foreign Automaker. The New York Times. Toyota Topped G.M. in U.S. Car Sales in 2021 - The New York Times (nytimes.com) ↩
Toyota Motors Corporation. (2021). Sustainability Bond. Woven Planet Bond Framework (Sustainability Bond Framework) ↩
Poliscanova, J. (2021, April 12). In cities 63% support EU ban on petrol and diesel car sales after 2030. Transport & Environment. ↩
Toyota expects annual production target shortfall as chip shortage drags on. (2022, January 18). Reuters ↩
Toyota Topped G.M. in U.S. Car Sales in 2021, a First for a Foreign Automaker (2022, January 5). The New York Times. Toyota Topped G.M. in U.S. Car Sales in 2021 - The New York Times (nytimes.com) ↩
Toyota Motors Corporation. (2021). Conflicts Minerals Report. FORM SD SPECIALIZED DISCLOSURE REPORT ↩
Sugiura, E. (2021, May 12). Toyota expects 2% profit rise as it shrugs off chip shortage. Nikkei Asia. Toyota expects 2% profit rise as it shrugs off chip shortage - Nikkei Asia ↩